
Cloud-Native Observability Series, Part 1: How to monitor PrimeHub 1-Click Install with Portainer
How to monitor the PrimeHub 1-Click Install with Portainer
The first step after setting up the PrimeHub 1-Click onto Kubernetes is to find the solutions for observability, including monitoring, logging, and tracing. This article shows the easy way to build it.
Previous I introduce K9S to monitor the Clusters with ~/.kube/config switch, this post shows the easy way to build with web-based monitoring.
Follow the Portainer CE Installation to setup onto your desktop, or the lab environment, as long as you have the Docker runtime.
There are two deploy methods onto your clusters: NodePort and Load Balancer. Here I use Load Balancer:
$ curl -L https://downloads.portainer.io/portainer-agent-ce29-k8s-lb.yaml \
  -o portainer-agent-k8s.yaml; kubectl apply -f portainer-agent-k8s.yaml

  % Total    % Received % Xferd  Average Speed   Time    Time     Time  Current
                                Dload  Upload   Total   Spent    Left  Speed
100  1593  100  1593    0     0   2482      0 --:--:-- --:--:-- --:--:--  2532
namespace/portainer created
serviceaccount/portainer-sa-clusteradmin created
clusterrolebinding.rbac.authorization.k8s.io/portainer-crb-clusteradmin created
service/portainer-agent created
service/portainer-agent-headless created
deployment.apps/portainer-agent created
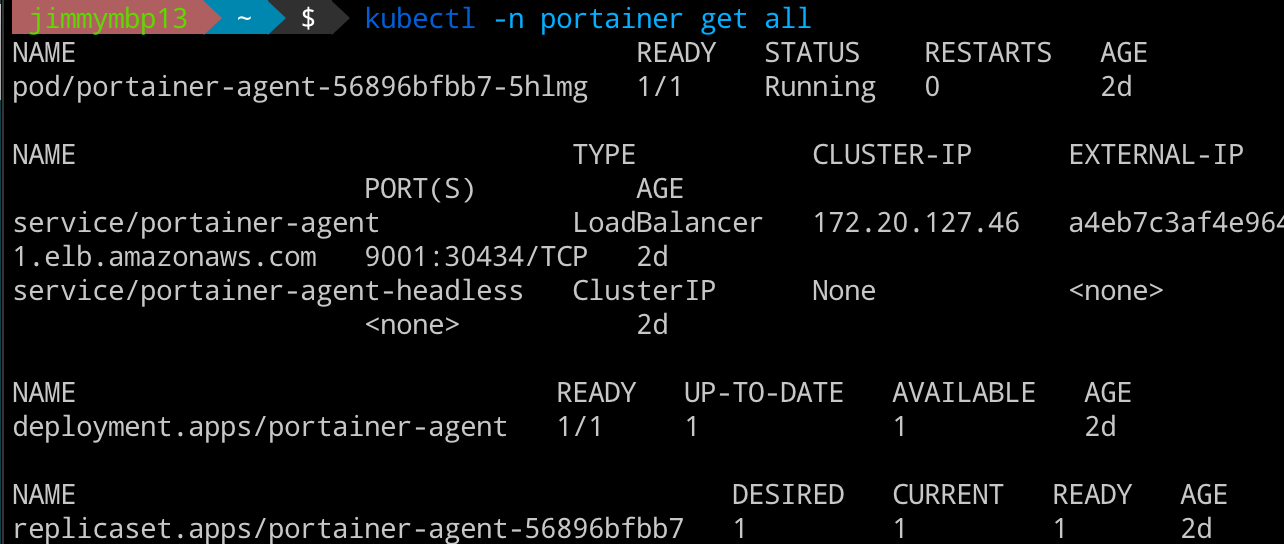
- Check the deploying
$ kubectl get svc -A

ingress-nginx   nginx-ingress-ingress-nginx-controller       LoadBalancer
  172.20.239.95 xxxx-xxxxxxxxxxxxxxxx.elb.us-east-1.amazonaws.com
  80:31297/TCP,443:31105/TCP,2222:30602/TCP   35m
...
portainer       portainer-agent                              LoadBalancer
  172.20.127.46    xxx-1518996078.us-east-1.elb.amazonaws.com
  9001:30434/TCP                              10s
and this
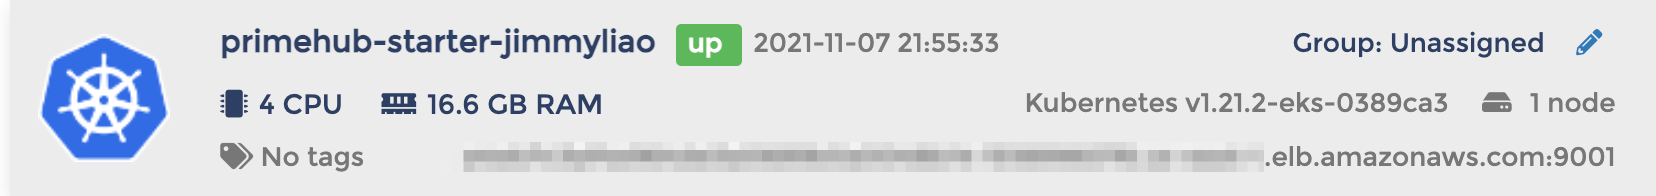
Add the environment: check the
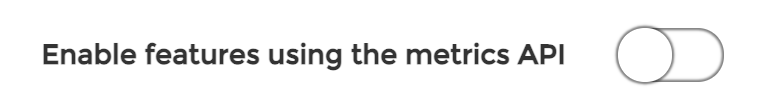
EXTERNAL-IPfrom the step 3. Then fill thePublic IPfield with same EXTERNAL-IP; theEnvironment URLisPublic IP:9001(Optional) If you want to enable the metrics server of AWS, follow this guide to install onto your cluster.
$ kubectl apply -f \
https://github.com/kubernetes-sigs/metrics-server/releases/latest/download/components.yaml

serviceaccount/metrics-server created
clusterrole.rbac.authorization.k8s.io/system:aggregated-metrics-reader created
clusterrole.rbac.authorization.k8s.io/system:metrics-server created
rolebinding.rbac.authorization.k8s.io/metrics-server-auth-reader created
clusterrolebinding.rbac.authorization.k8s.io/metrics-server:system:auth-delegator created
clusterrolebinding.rbac.authorization.k8s.io/system:metrics-server created
service/metrics-server created
deployment.apps/metrics-server created
apiservice.apiregistration.k8s.io/v1beta1.metrics.k8s.io created
$ kubectl get deployment metrics-server -n kube-system

NAME             READY   UP-TO-DATE   AVAILABLE   AGE
metrics-server   1/1     1            1           38s
- Finally to see it on the Portainer Console.
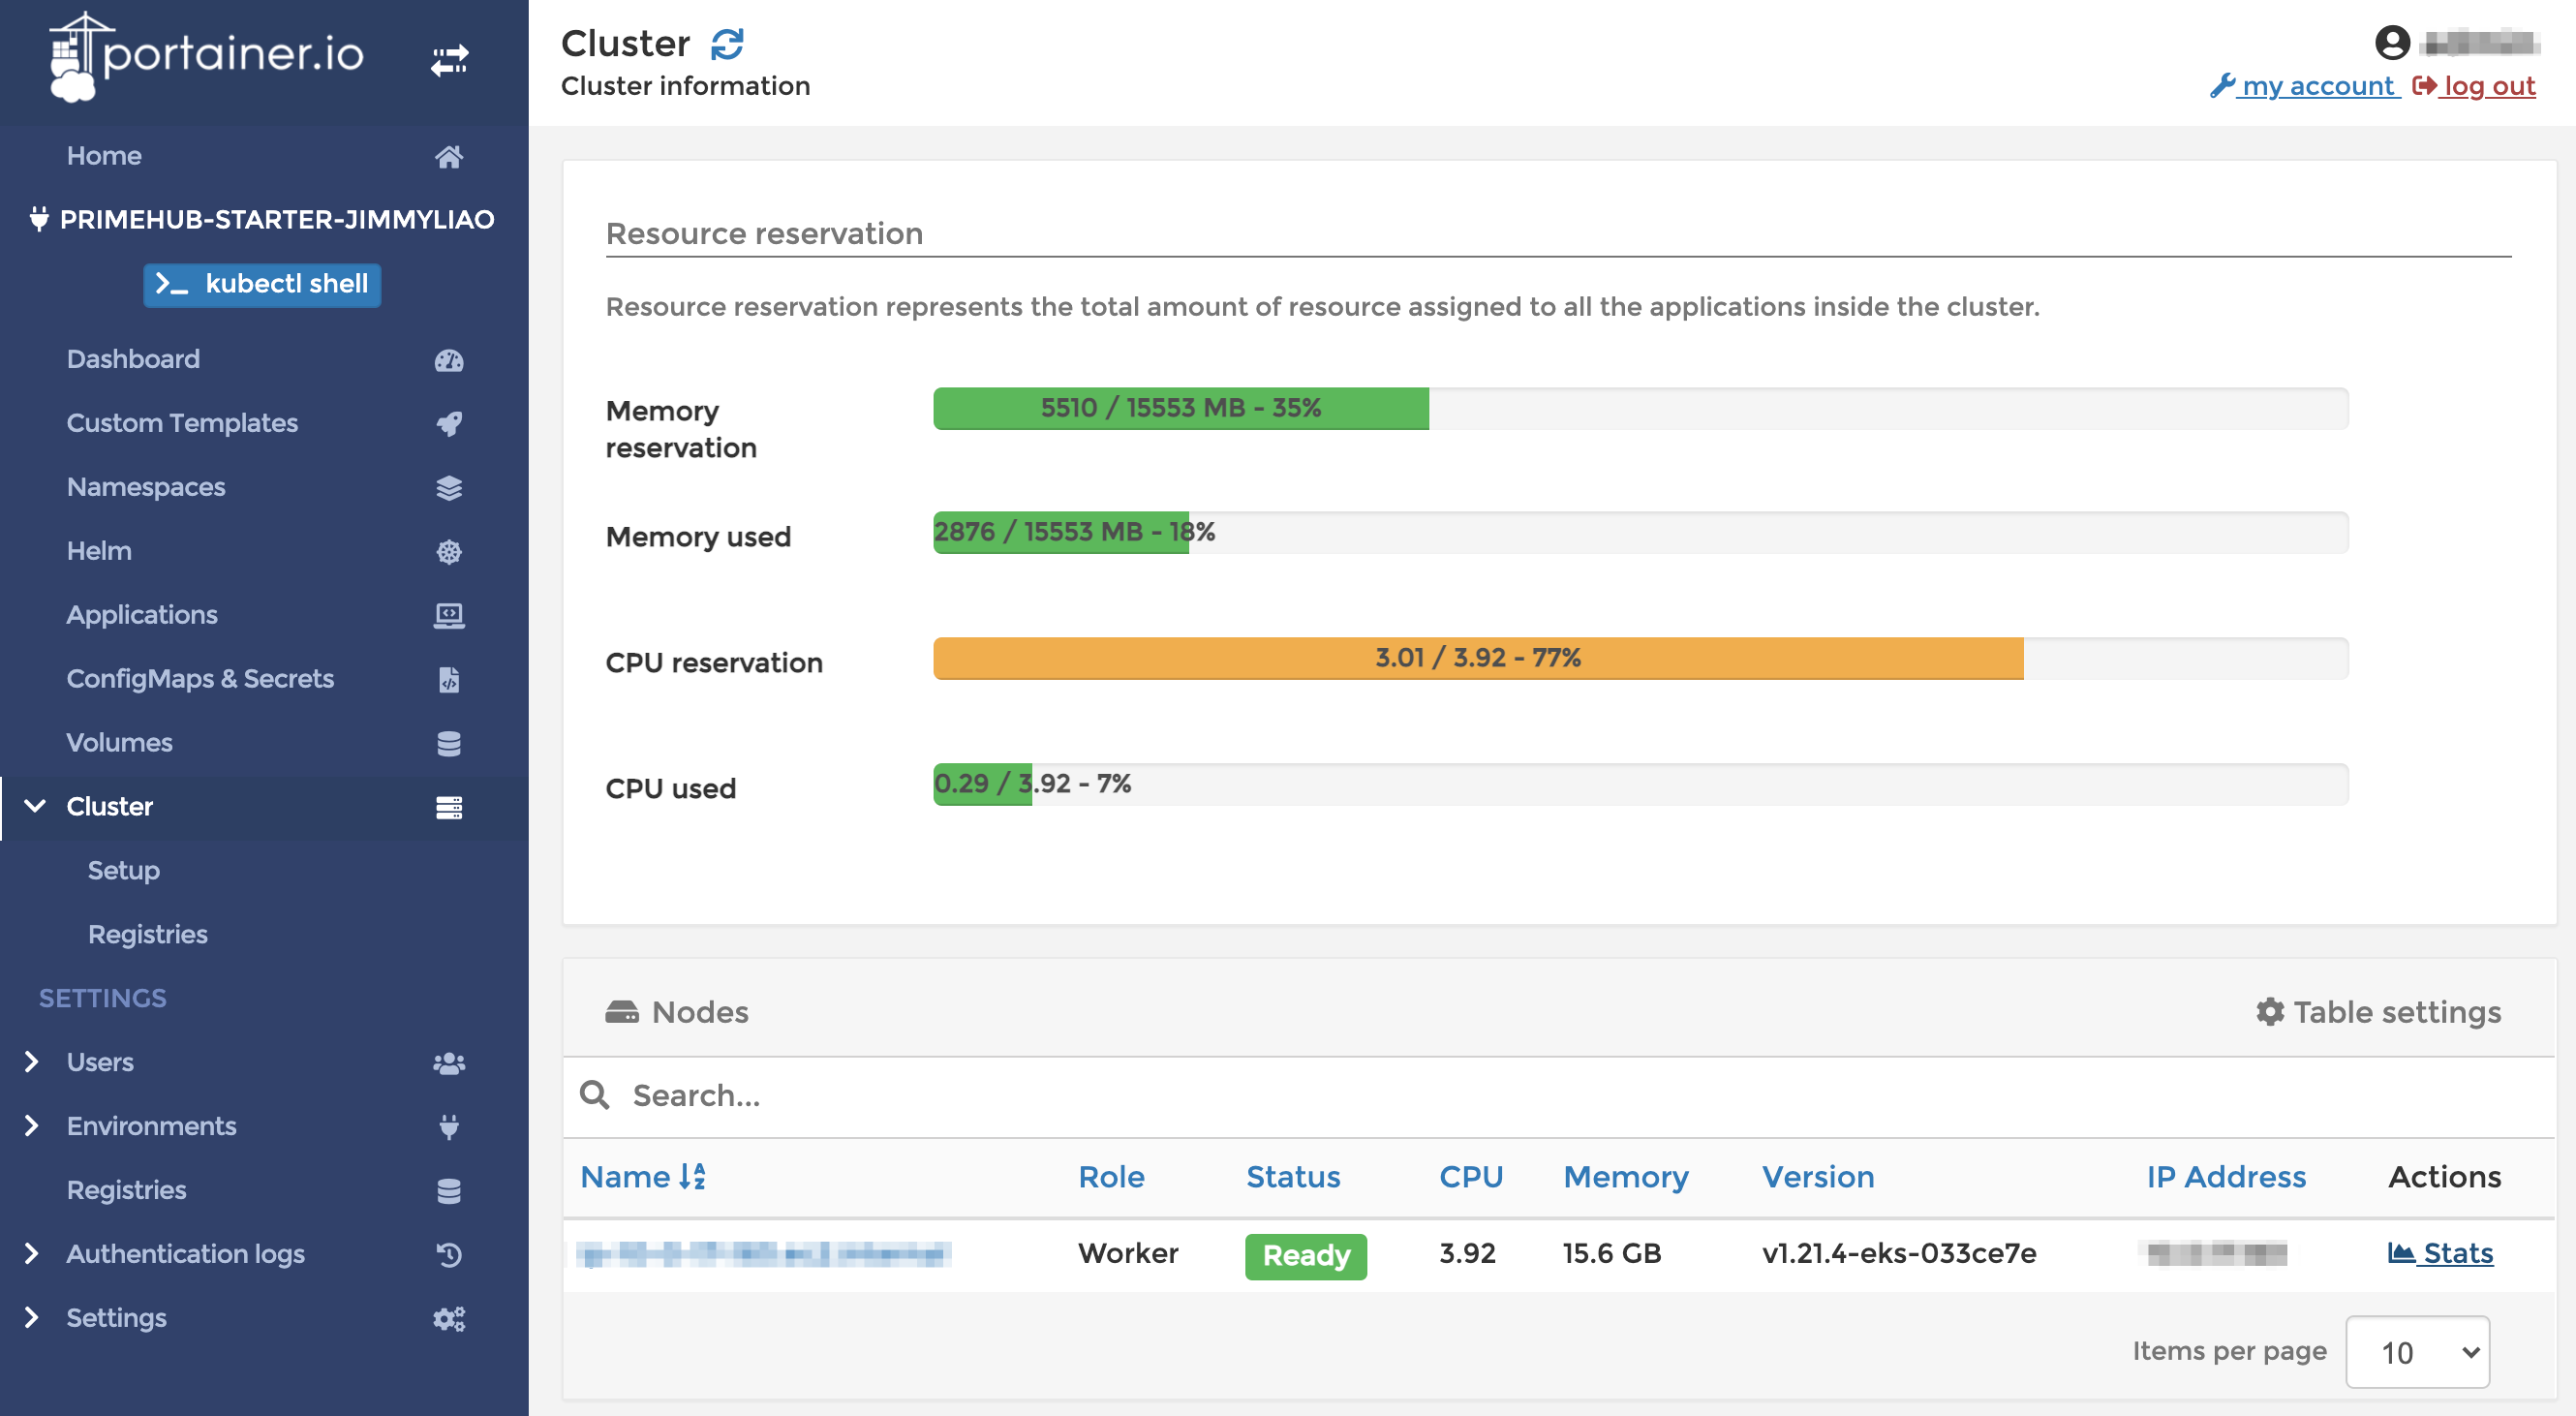
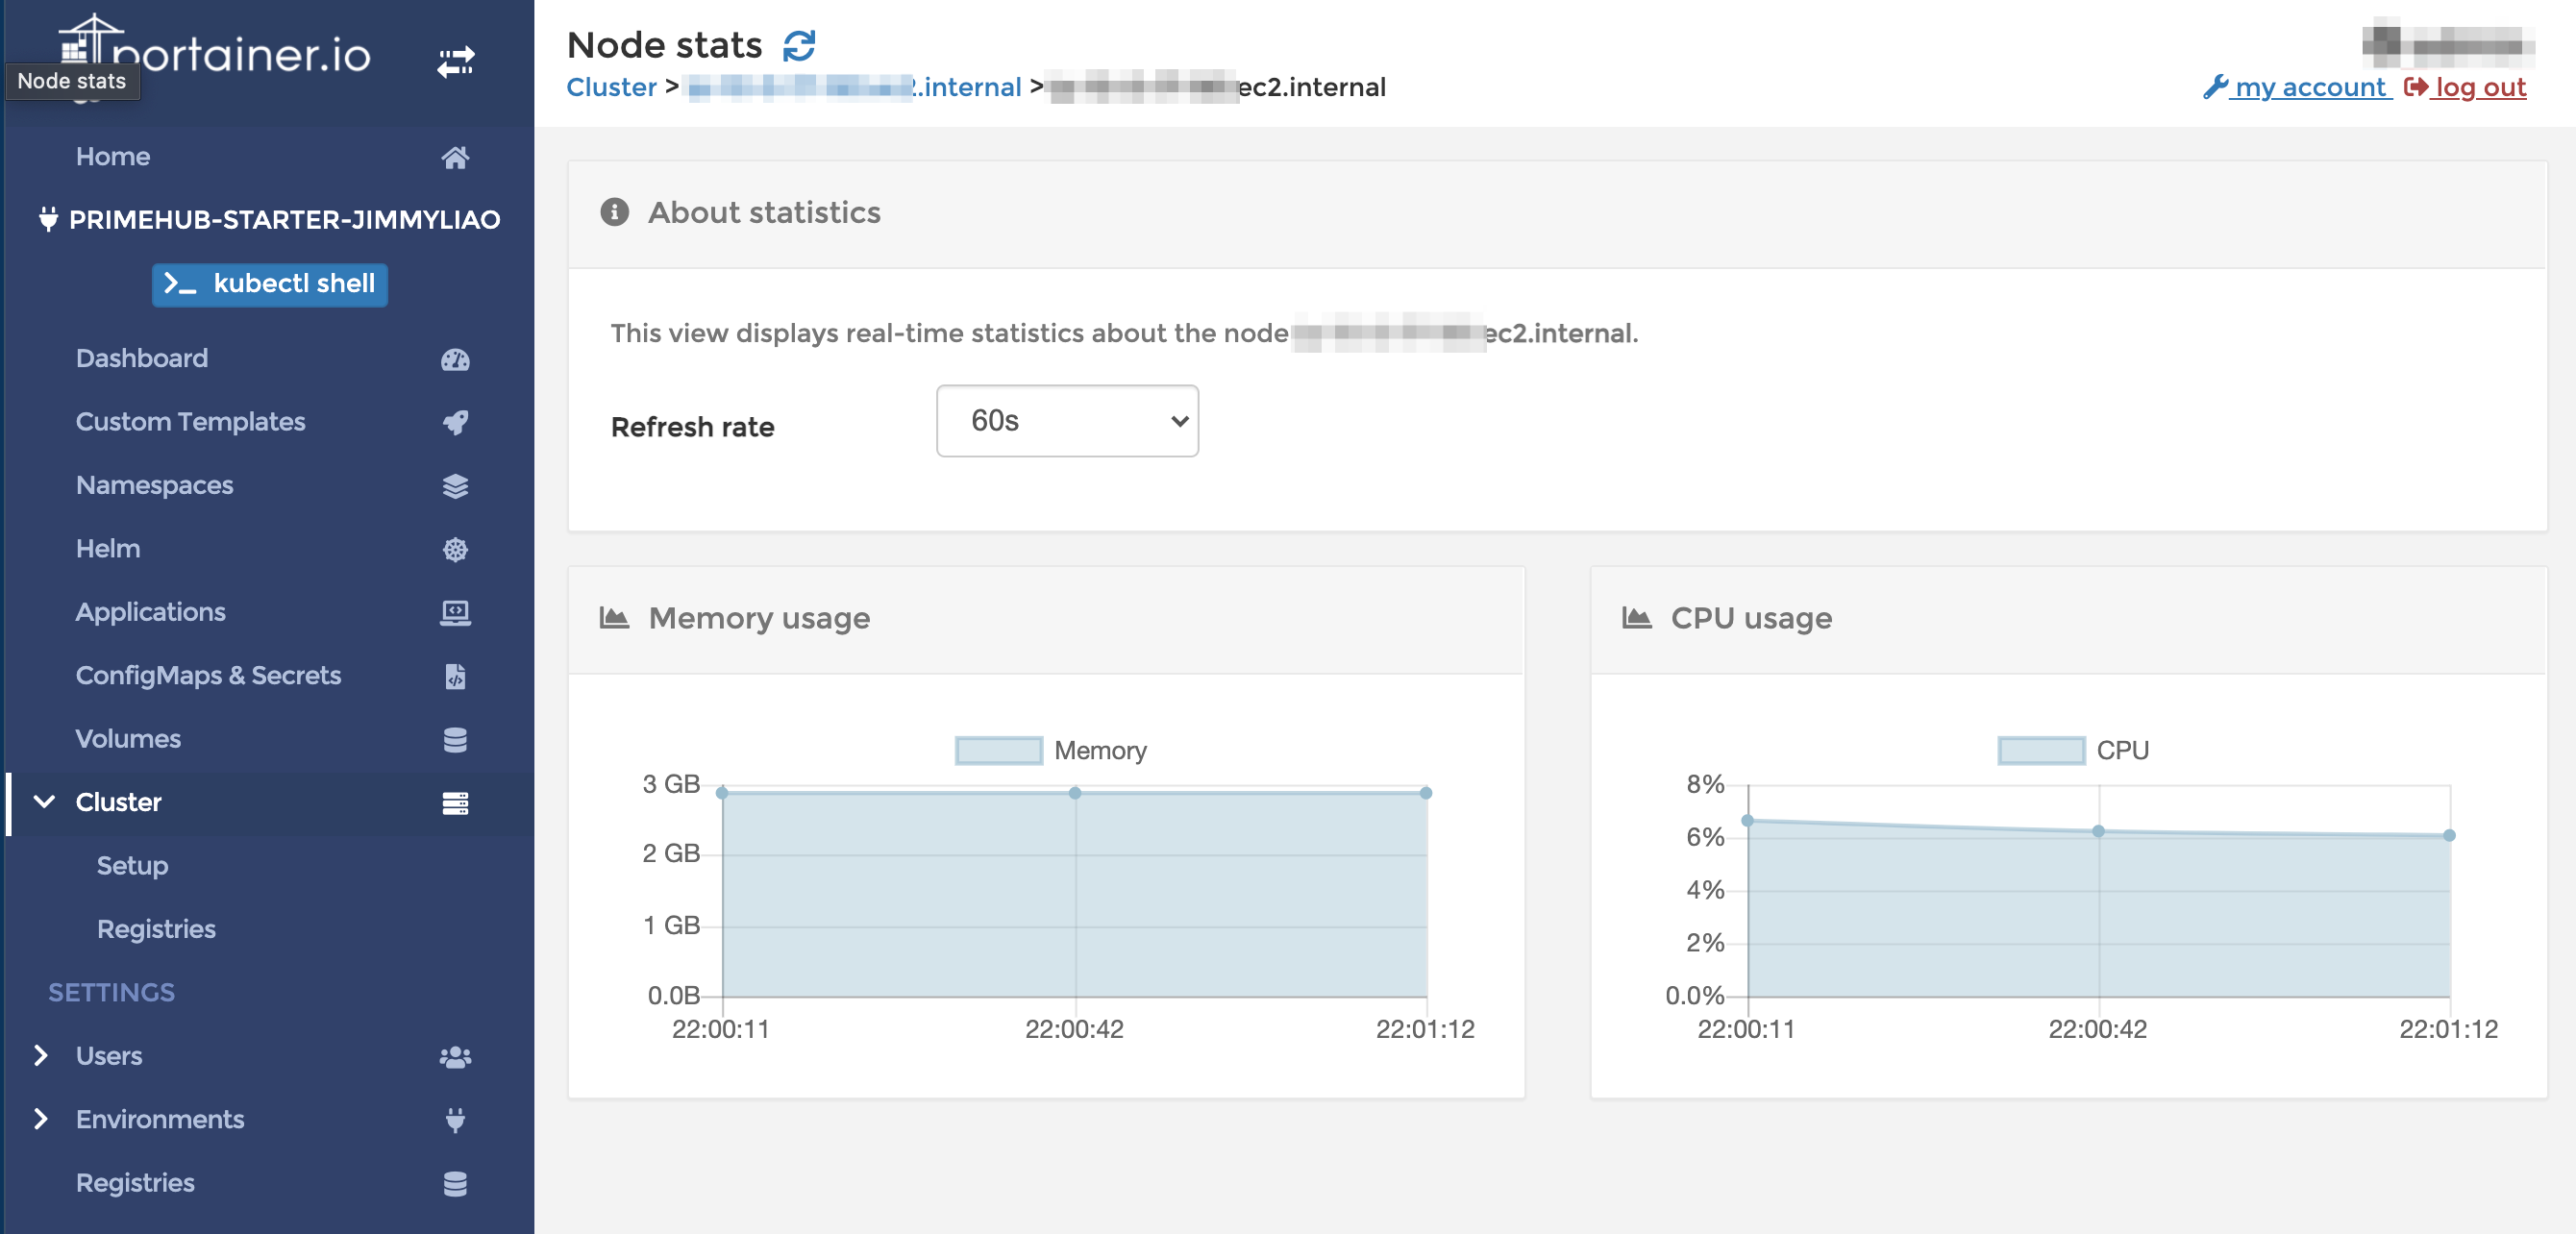
Enjoy!